Kinesiology
The Kinesiology major is for students interested in studying the art and science of human movement. With a solid foundation in the sciences, the program in Kinesiology is composed of coursework that provides students a thorough understanding of the human body, how it functions, and how it responds and adapts to physical activity. Additionally, upper level courses emphasize the role of physical activity in the promotion of health and prevention of disease. A degree in Kinesiology provides a solid preparation for students interested in pursuing graduate work and acceptance in professional programs such as physical and occupational therapy.
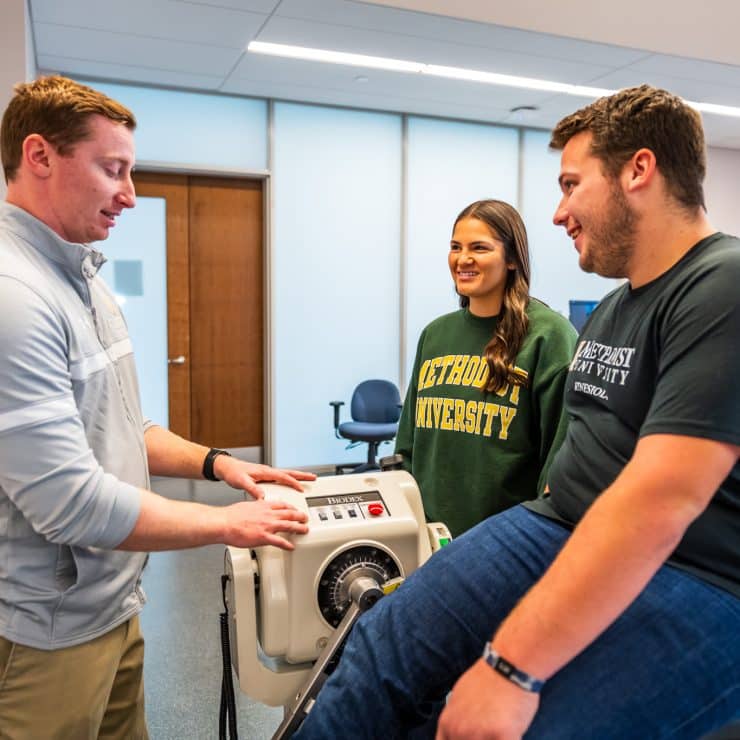
The Department of Kinesiology is housed within the School of Health Sciences and is located in the Thomas R. McLean Health Sciences Building. This 30,000 square foot facility features state-of-the-art laboratories and classrooms that may be utilized by students majoring in Kinesiology.
Common Career Paths
Some of the top jobs for those with Kinesiology bachelor degrees include kinesiologist, personal trainer, chiropractor, exercise physiologist, athletic trainer, and so much more.
Common Salary Ranges for Graduates
As mentioned above, there’s a long list of career opportunities for those with Kinesiology degrees. But, the U.S. Bureau of Labor Statistics reports the average annual salary for the following positions (which may require additional education) in North Carolina in 2021:
- Chiropractor: $81,240
- Athletic trainer: $54,650
- Exercise physiologist: $54,030
Average Tuition Cost
The average cost for an incoming residential freshman to attend MU is less than $18,000 – similar to the cost of attending one of the big-box public schools, but with the enhanced value of a highly-regarded private school with a 12:1 student-to-faculty ratio.
While tuition varies, depending on a student’s financial aid package, it’s important to know that the average financial award for an incoming residential freshman at MU is more than $34,000.
Financial Aid & Scholarships
More than 97% of MU students receive some form of financial aid, with the University offering more than $24 million annually to students for scholarships. If a student is active military, family of active military, or a veteran, they may also qualify for MU’s military education benefits.
Interested in Methodist University’s Kinesiology program?
If you have questions, see the FAQ below or reach out to Dr. Jordan Bettleyon using the contact info at the bottom of the page. If you’re ready to apply today, click the button below!
Mission
The mission of the department of Kinesiology is to develop the student’s prerequisite knowledge in preparation for graduate work in various health-related professional programs by engaging the student in a curriculum with a solid foundation in the basic sciences.
Goals
- Graduates will have the necessary preparation and prerequisite coursework to be strong applicants for professional programs in either physical therapy or occupational therapy.
- Graduates will have the knowledge, skills, and abilities to obtain employment as exercise professionals in a variety of settings.
- Graduates will have the knowledge, skills, and abilities to enter graduate programs in kinesiology.
Frequently Asked Questions
Yes. Kinesiology is a STEM discipline. It focuses on the study and intersection of sport, movement, exercise, and well-being.
Many Kinesiology industry members consider the field to be a great career. Not only is Kinesiology a growing career path, but graduates often find jobs with competitive salaries and rewarding experiences.
While Kinesiology may not be as difficult as some STEM career paths, it does require graduates to grasp a lot of information while having the ability to have great people skills.
Contact
Jordan Bettleyon, D.A.T., ACSM-EP, CSCS